Broker observability
A Broker will be configured with custom logger settings and exposing metrics for Prometheus.
Instructions
The solution will include:
- RedisBroker, that will accept and deliver events.
- ConfigMap that contains observability settings.
- Trigger, which subscribes to events and push them to a configured target.
- Target that consumes events.
Broker and Prometheus
Create a ConfigMap that enables prometheus metrics at port 9090.
kubectl apply -f https://raw.githubusercontent.com/triggermesh/triggermesh-core/main/docs/assets/manifests/observability/config-observability.yaml
Create a RedisBroker named metrics-demo.
kubectl apply -f https://raw.githubusercontent.com/triggermesh/triggermesh-core/main/docs/assets/manifests/observability/broker.yaml
Wait until the RedisBroker is ready. It will inform in its status of the URL where events can be ingested.
kubectl get redisbroker metrics-demo

NAME   URL                                                        AGE   READY   REASON
demo   http://metrics-demo-rb-broker.default.svc.cluster.local   10s   True
Prometheus can be easily installed following one of this methods:
- Helm Charts.
- Prometheus Operator
- Kube Prometheus manifests and scripts
All TriggerMesh Broker Pods expose the metrics port and are labeled like this.
  labels:
    app.kubernetes.io/component: broker-deployment
    app.kubernetes.io/managed-by: triggermesh-core
    app.kubernetes.io/part-of: triggermesh
...
    ports:
    - containerPort: 9090
      name: metrics
Configure the Prometheus scrape to use the additional Pod monitors.
  additionalPodMonitors:

  - name: triggermesh-components
    jobLabel: app.kubernetes.io/name
    namespaceSelector:
      any: true
    selector:
      matchLabels:
        app.kubernetes.io/part-of: triggermesh
    podMetricsEndpoints:
    - port: metrics
Refer to the Prometheus deployment method to access Grafana. When using the Helm chart, port-forwarding the grafana service and using the credentials from the monitoring/kube-prometheus-stack-grafana secret will.
kubectl -n monitoring get secret kube-prometheus-stack-grafana -o jsonpath='{.data.admin-user}' | base64 -d

kubectl -n monitoring get secret kube-prometheus-stack-grafana -o jsonpath='{.data.admin-password}' | base64 -d
Ingest Metrics
To be able to use the broker we will create a Pod that allow us to send events inside the Kubernetes cluster.
kubectl apply -f https://raw.githubusercontent.com/triggermesh/triggermesh-core/main/docs/assets/manifests/common/curl.yaml
It is possible now to send events to the broker address by issuing curl commands. The response for ingested events must be an HTTP 200 which means that the broker has received it and will try to deliver them to configured triggers.
kubectl exec -ti curl -- curl -v http://metrics-demo-rb-broker.default.svc.cluster.local/ \
    -X POST \
    -H "Ce-Id: 1234-abcd" \
    -H "Ce-Specversion: 1.0" \
    -H "Ce-Type: demo.metrics1" \
    -H "Ce-Source: curl" \
    -H "Content-Type: application/json" \
    -d '{"test1":"ingress"}'
Use different Ce-Type values and send a number of event requests to be ingested by the broker, then open Grafana's metrics explorer and show broker_ingest_event_count metrics.
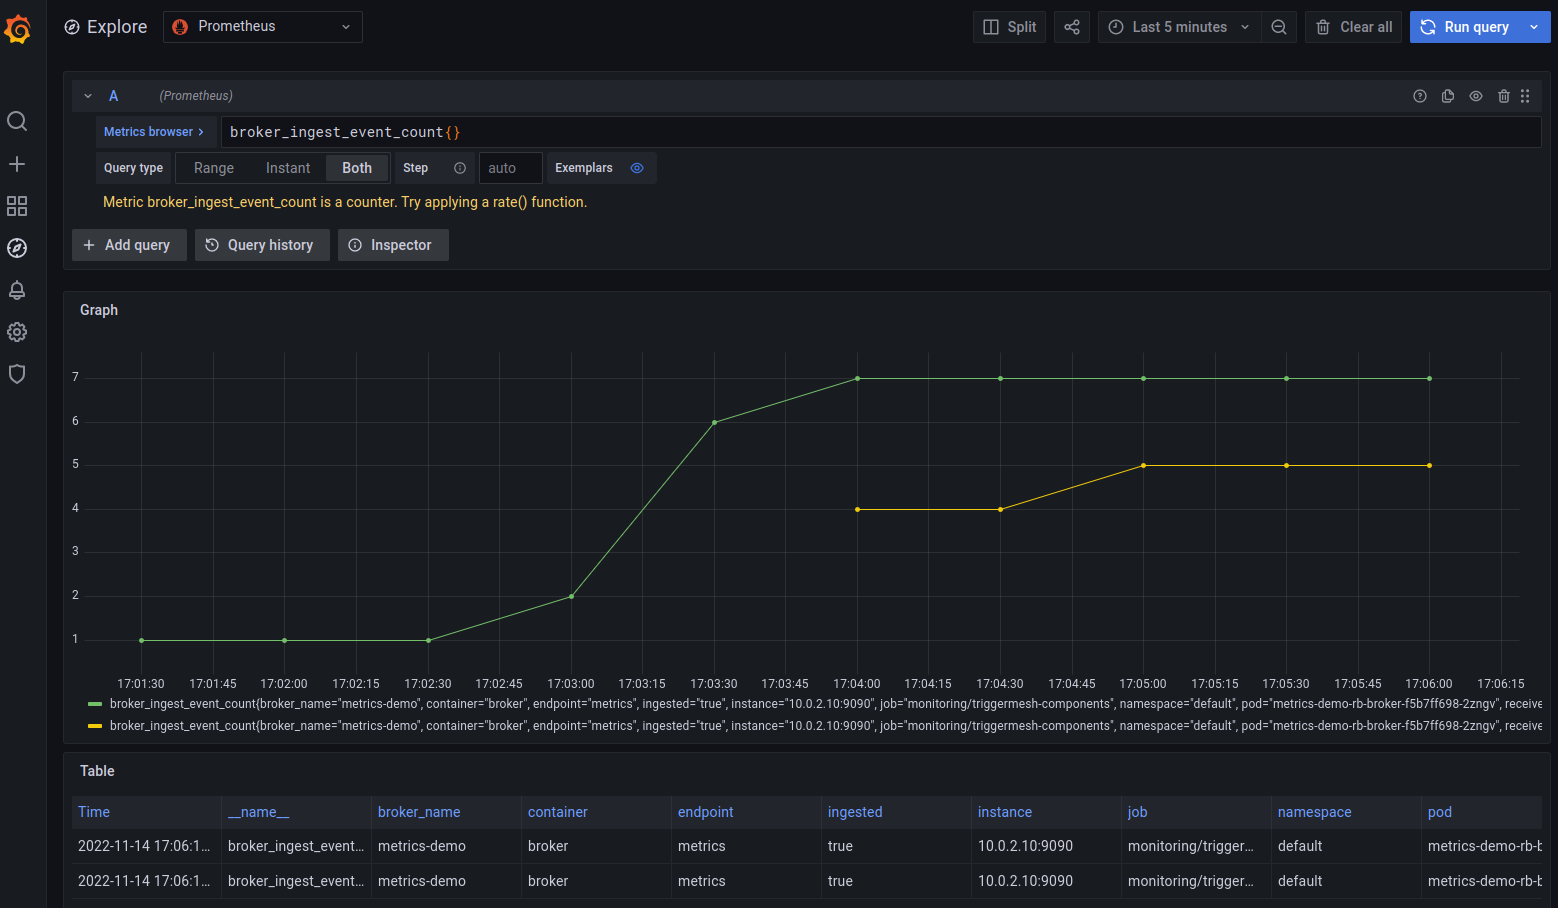
Incoming requests expose metrics:
broker_ingest_event_countfor a global count of incoming requests.broker_ingest_event_latency_bucketfor the incoming requests latencies bucket.
Trigger Metrics
We will create a target service and a Trigger pointing to it in order to gather Trigger metrics.
# Event display service
kubectl apply -f https://raw.githubusercontent.com/triggermesh/triggermesh-core/main/docs/assets/manifests/common/display-target.yaml

# Trigger using event display service
kubectl apply -f https://raw.githubusercontent.com/triggermesh/triggermesh-core/main/docs/assets/manifests/observability/trigger.yaml
The Trigger configures a filter that will deliver any event whose type is prefixed demo.
spec:
  broker:
    kind: RedisBroker
    group: eventing.triggermesh.io
    name: metrics-demo
  filters:
  - any:
    - prefix:
        type: demo.
Just as before, use the curl pod to produce events with different Ce-Type values that start with demo.. Then use Grafana's metrics explorer and show broker_ingest_event_count metrics.
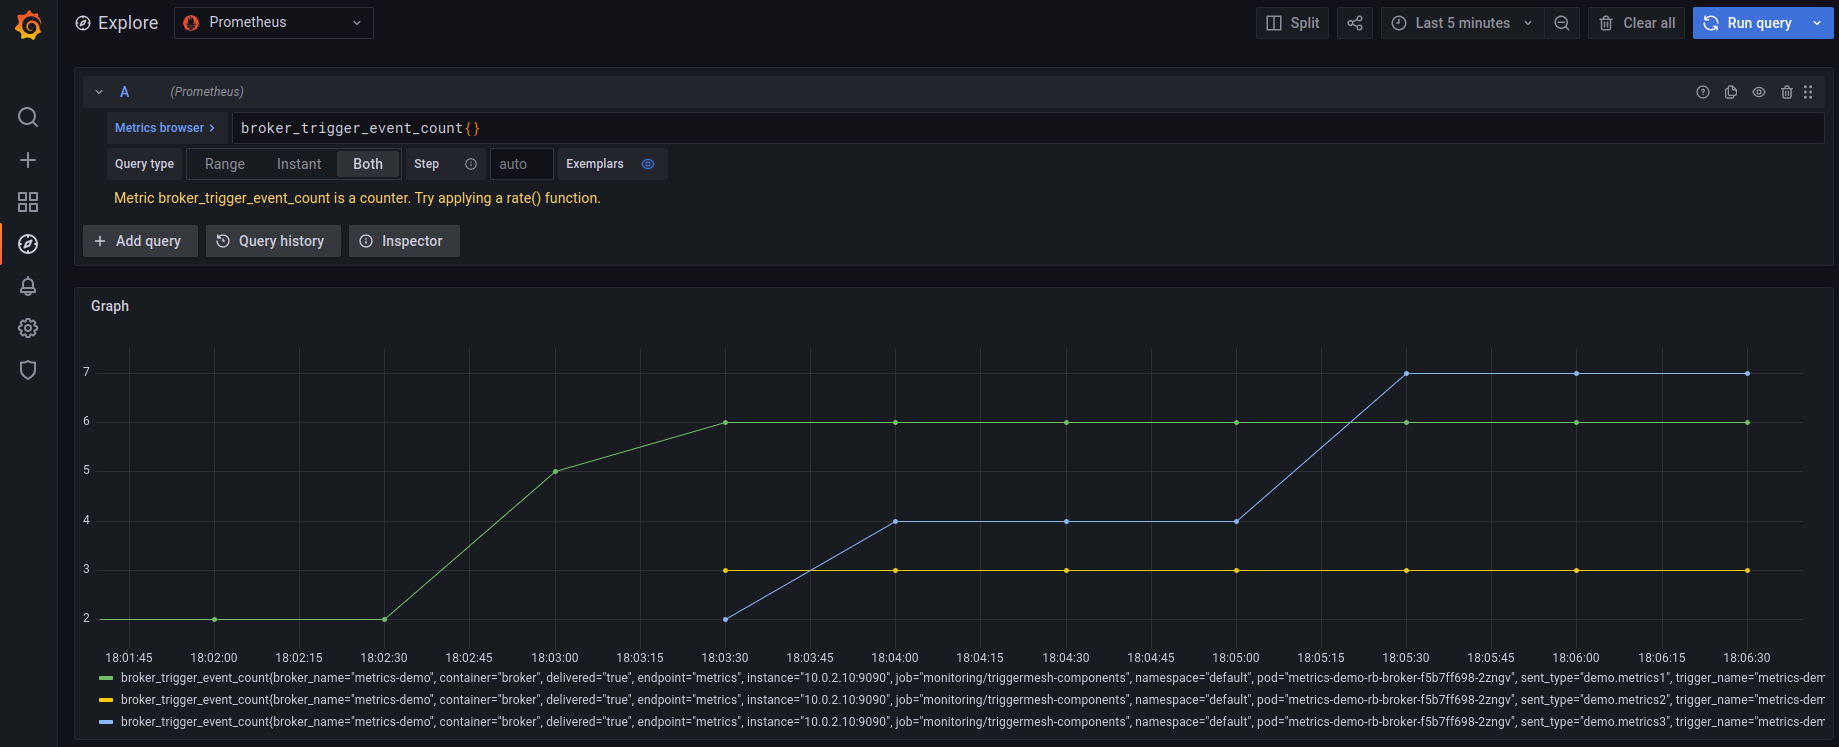
Incoming requests expose metrics:
broker_trigger_event_countfor a global count of outgoing events.broker_trigger_event_latency_bucketfor the outgoing events latencies bucket.
Clean Up
To clean up the getting started guide, delete each of the created assets:
# Removal of display-target not in this list, since it was deleted previously.
kubectl delete -f \
https://raw.githubusercontent.com/triggermesh/triggermesh-core/main/docs/assets/manifests/observability/trigger.yaml,\
https://raw.githubusercontent.com/triggermesh/triggermesh-core/main/docs/assets/manifests/common/display-target.yaml,\
https://raw.githubusercontent.com/triggermesh/triggermesh-core/main/docs/assets/manifests/observability/broker.yaml,\
https://raw.githubusercontent.com/triggermesh/triggermesh-core/main/docs/assets/manifests/observability/config-observability.yaml,\
https://raw.githubusercontent.com/triggermesh/triggermesh-core/main/docs/assets/manifests/common/curl.yaml